Dear Educator, This Earth Day, use data to spark curiosity about climate and energy.
When you hand students a graph instead of a talking point, the conversation isn't about who's right; it's about what the numbers show, what might explain them, and what questions to ask next.
CFR Education uses reputable data sources to create visuals that convey complex concepts. In the climate and energy resources highlighted in this newsletter, you will find maps, charts, and graphs to teach concepts such as:
Happy learning, Caroline Netchvolodoff
Vice President, Education
Council on Foreign Relations |
|
|
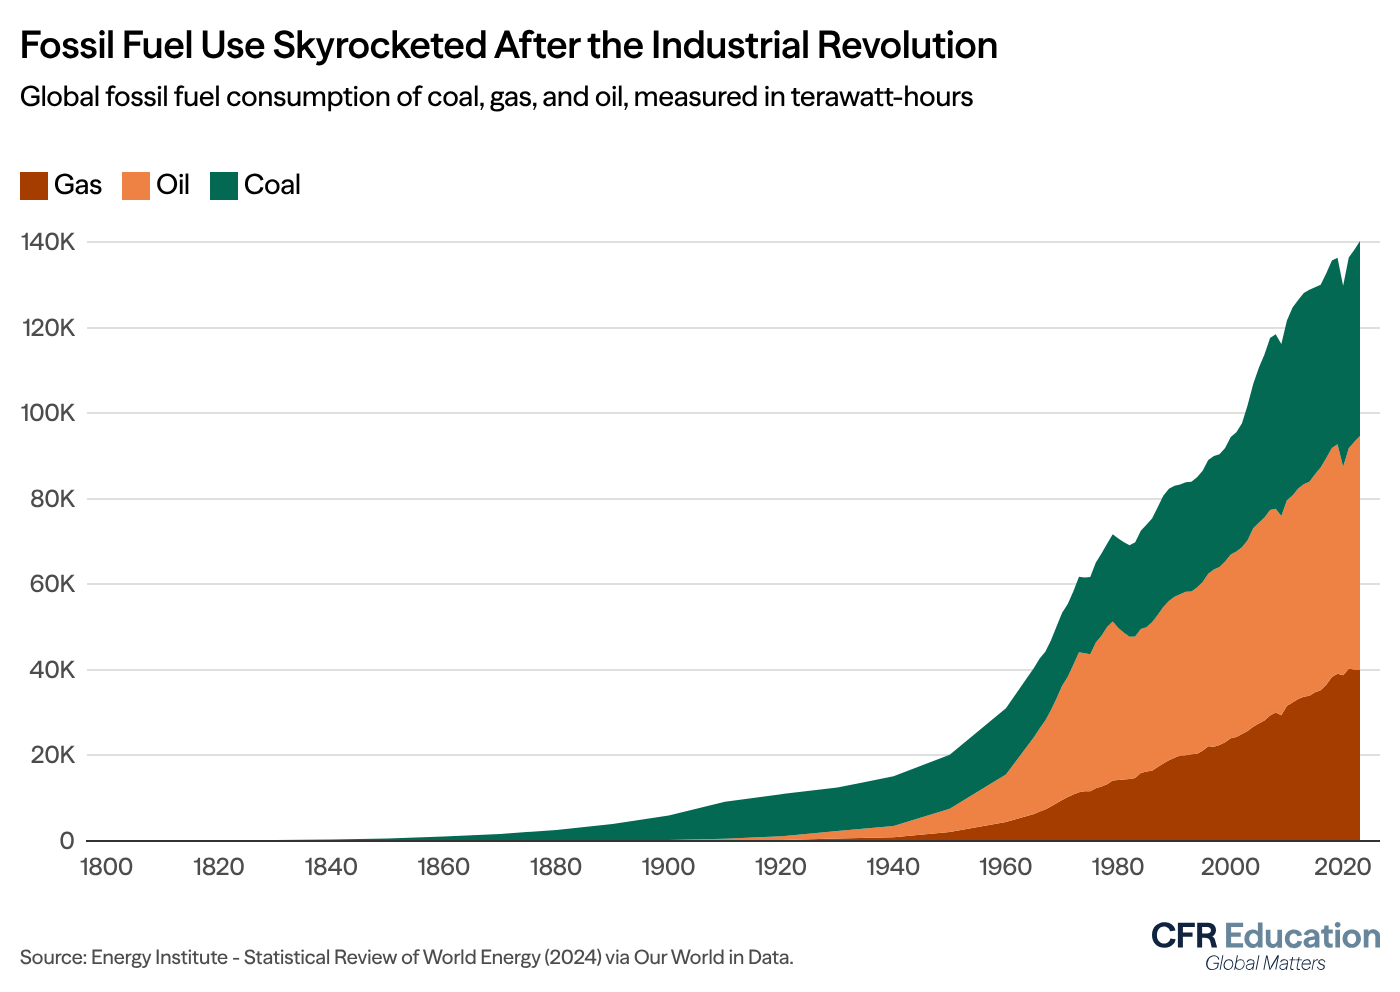
Climate change is not a new phenomenon. To paint a picture of how today’s climate change challenges arose, embed these important conversations in your students’ history lessons.
These two resources can be used to connect the hidden environmental costs of everyday life with the technological innovations of the eighteenth and nineteenth centuries.
This graph can help your students visualize this connection. |
Once your students understand how fossil fuel use has historically followed an exponential growth trajectory and how it has impacted our climate, use these timelines to catch them up to the present: |
|
|
New blog: Three Ways to Discuss Climate in the Classroom for Earth Day |
Every classroom is different, which is why CFR Education partnered with Climate Mental Health Network and SubjectToClimate to offer multiple angles to consider for your Earth Day lessons. |
|
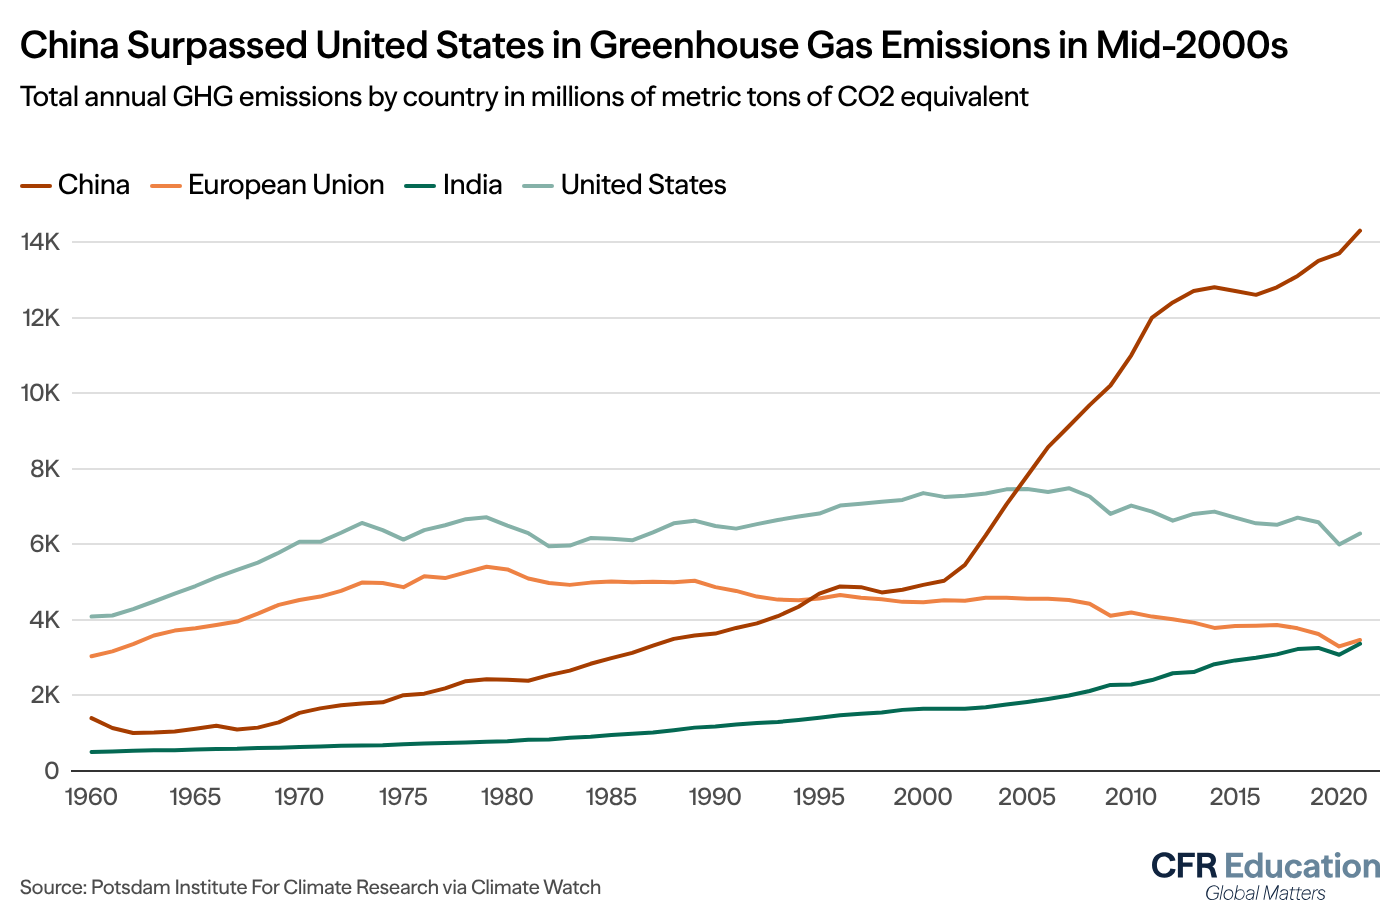
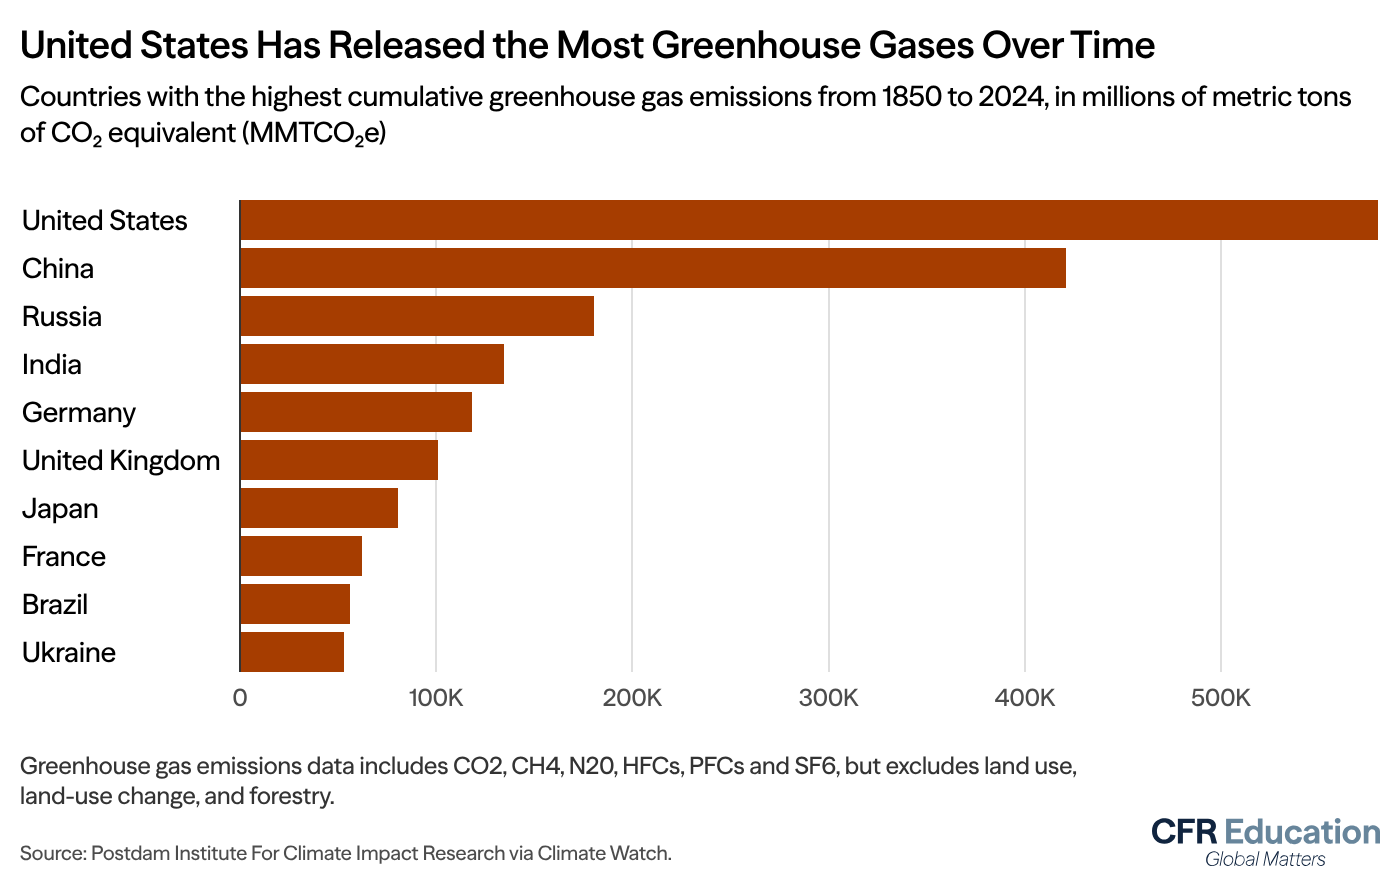
| One of the most critical questions in discussing climate solutions is: who is responsible for climate change? Knowing both who is polluting and how it’s measured is key to any analysis. Use this resource to help students understand how the world measures greenhouse gas emissions and how different approaches imply different levels of responsibility. Have your students compare and contrast the two graphs. Why does the time period we look at matter? Which measure do they think is more relevant when determining who bears the largest responsibility: cumulative or annual emissions? |
|
|
Data Insights: Why use two chart types? The line chart shows how many emissions countries produce in a given year, while the bar chart shows how many emissions countries have produced in total. Both charts measure countries’ contributions to climate change; however, the different ways they measure it result in different top contributors. This divergence informs a fundamental point in international debates over global climate action.
|
|
|
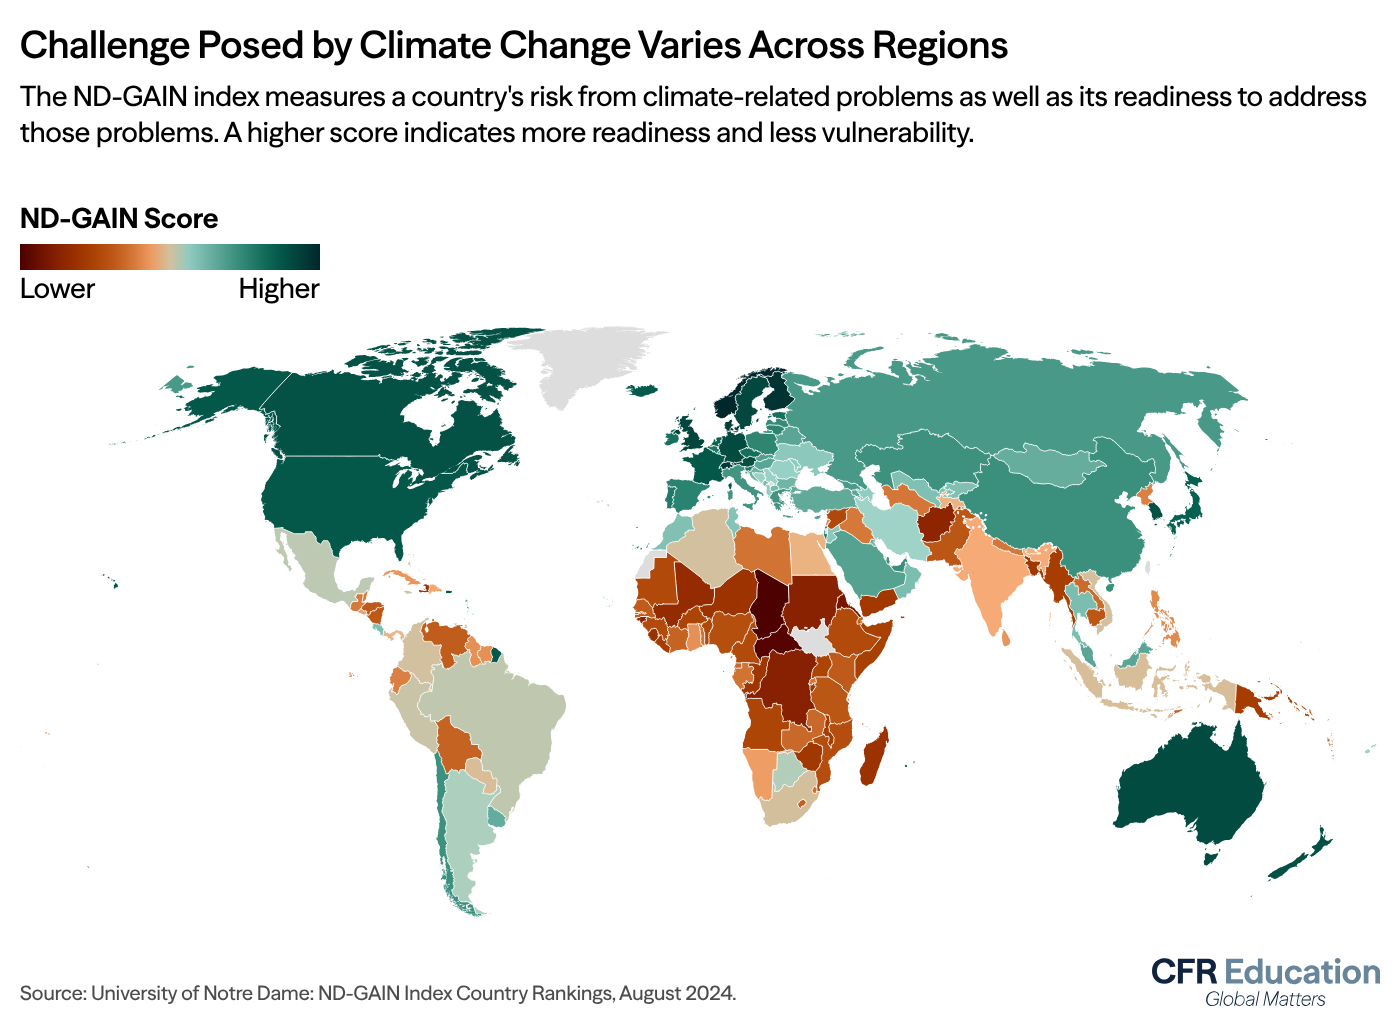
Zooming out and taking a broader view is a good way to visualize complex topics, such as climate change. This method of visualizing data also reinforces the interconnectedness of global issues – how do events in different parts of the world affect students everywhere?
The map below shows the ND-GAIN score for each country, which ranks countries based on two main dimensions: vulnerability and readiness. Vulnerability refers to a country’s risk from climate-related problems, while readiness refers to the country’s current capabilities to address the problems. The index was built to help countries prioritize their climate well-being and build an effective, efficient response to the threats posed by climate change.
|
Use this visualization to help students analyze the current state of climate risk worldwide. Then use the resources below to discuss why the map may look this way, and ask students to consider which countries can reduce their vulnerability by increasing their resilience. |
|
|
Data Insights: Use the interactive version of this map on the CFR Education website to gain more insights into the countries. For example, ask your students to hover over a country to see its index score, income group, and global rank.
|
|
|
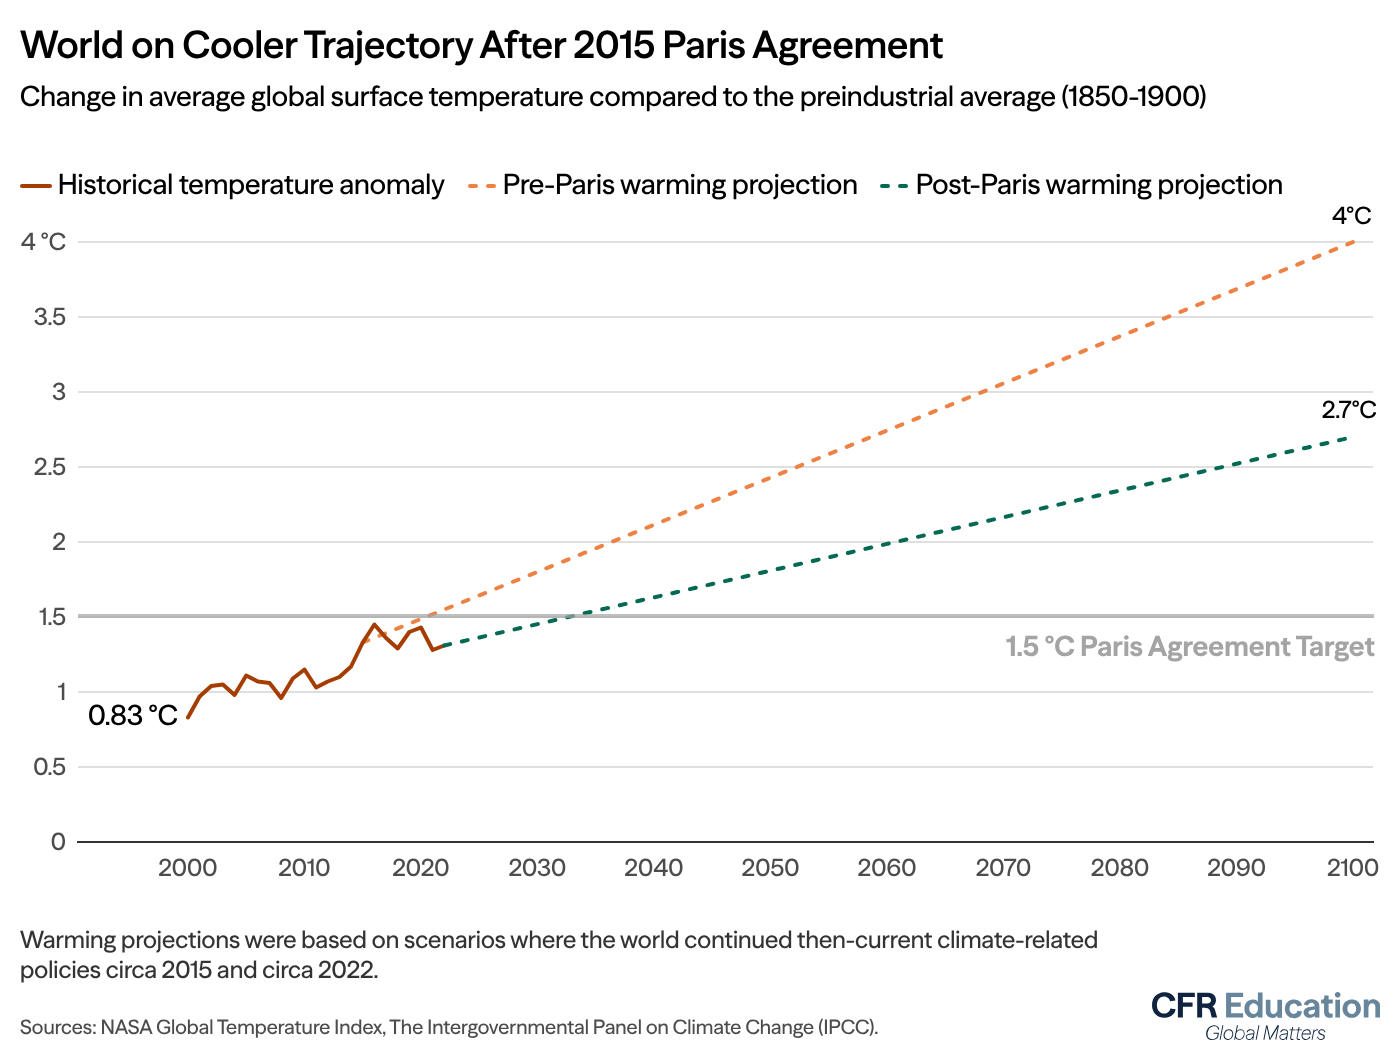
Teaching about climate change doesn’t have to feel negative. Already, leaders around the globe have come together and established international agreements to take collective action against the adverse effects of climate change. To help your students visualize the positive impact of international cooperation, use the graph below to show how the Paris Agreement, established in 2015, significantly improved warming predictions (even if experts agree that emissions still aren’t declining fast enough).
|
With a concrete understanding of climate action to date, students will be better prepared to imagine, discuss, and defend additional solutions. Equip our future agreement-makers with crucial skills using this climate change simulator activity. |
|
|
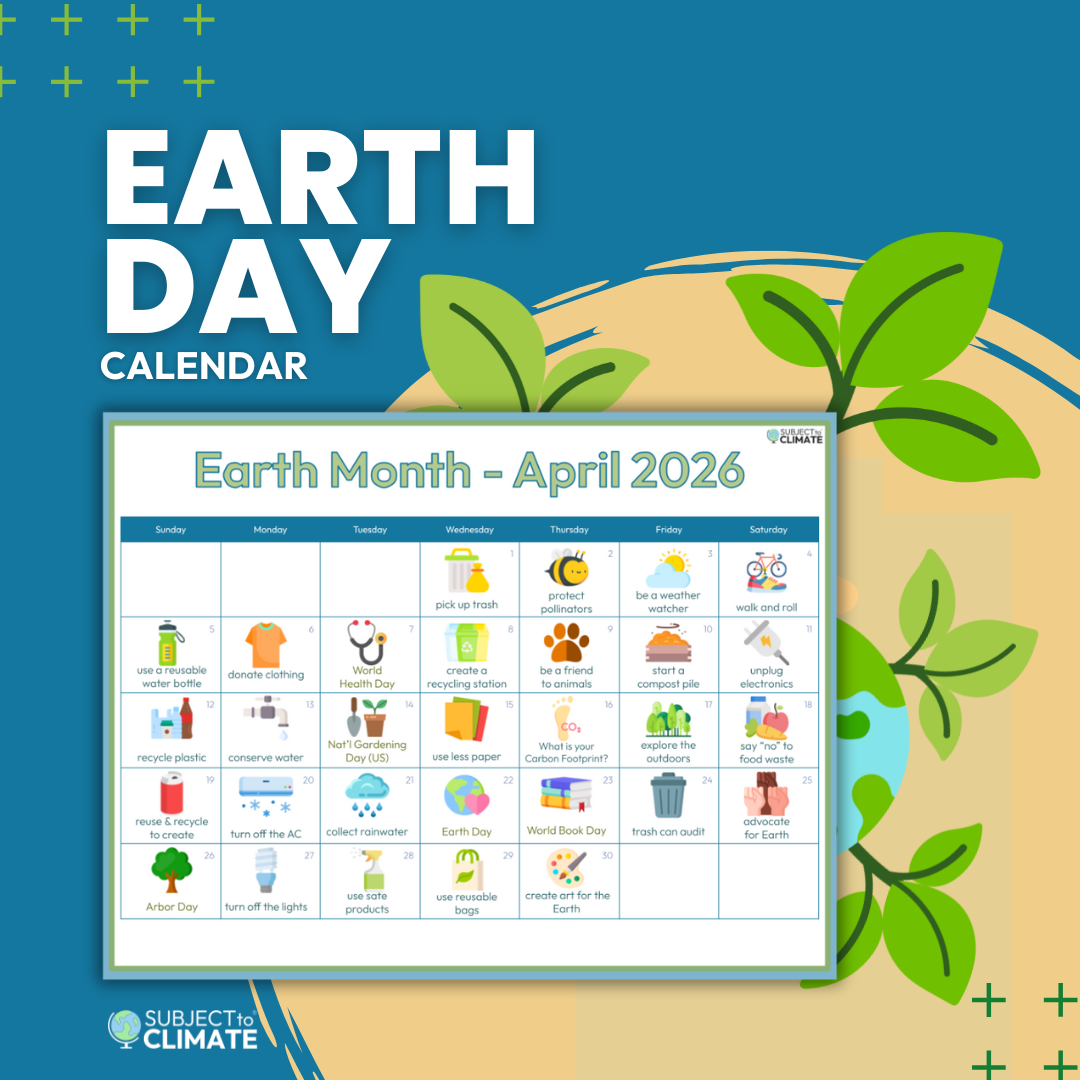
Earth Day Activities for Every Day of April |
| |
|
Council on Foreign Relations. All rights reserved. |
58 East 68th Street – New York, NY 10065 1777 F Street, NW – Washington, DC 20006 |
|
|
|