Telegraf 1.40, Manufacturing Time Series, InfluxDB 3 + Grafana

What's New with InfluxDB

Newsletter Updates: September 16, 2026

Product

What’s New With Telegraf 1.40


A new feature-bearing release for Telegraf is now available.

  • Databricks Zerobus output plugin: streams metrics into Unity Catalog Delta tables over gRPC
  • Fritzbox Smarthome input plugin: reads device metrics from AVM FRITZ! routers
  • Also in this release: Cisco telemetry and SMART reporting fixes, an Elasticsearch plugin migration to v7/v8/v9 support, and removal of inputs.aerospike, inputs.sflow, and outputs.amon
 
Blog

Building a Practical Time Series Data Layer for Automotive Manufacturing
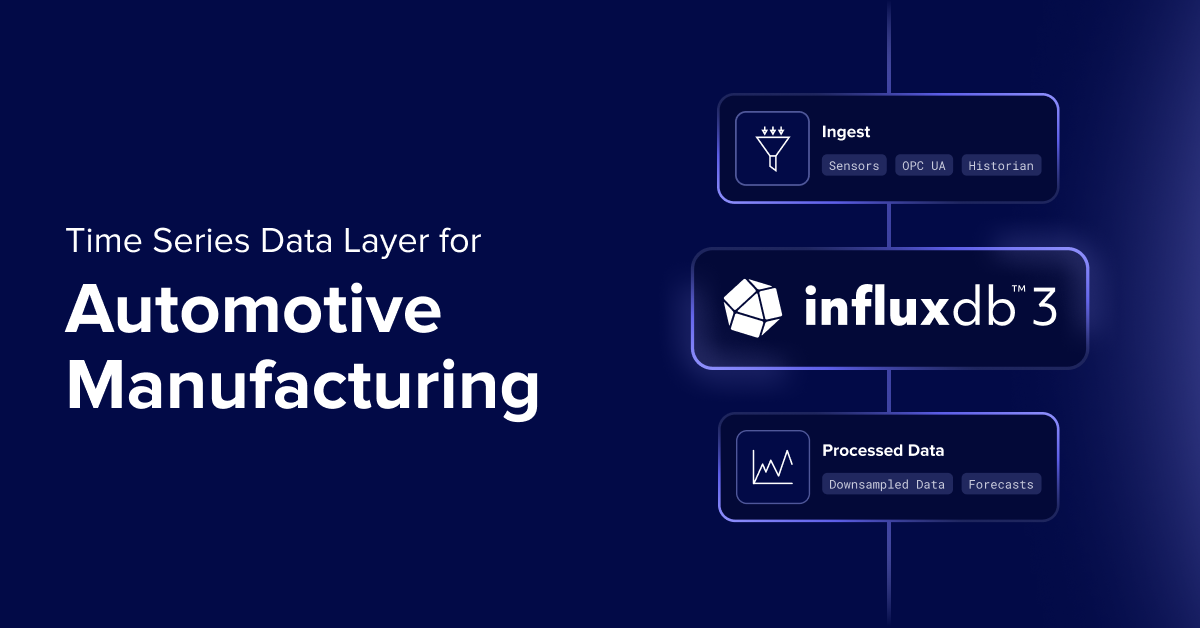

Automotive manufacturing generates data at several operating cadences. Sensors and controllers emit measurements continuously. Equipment and line states change as events. Production and quality systems add context at the part, batch, shift, and plant level. Together, these records describe how a manufacturing process behaves over time.

 
Blog

Getting Started with InfluxDB 3 and Grafana Tutorial
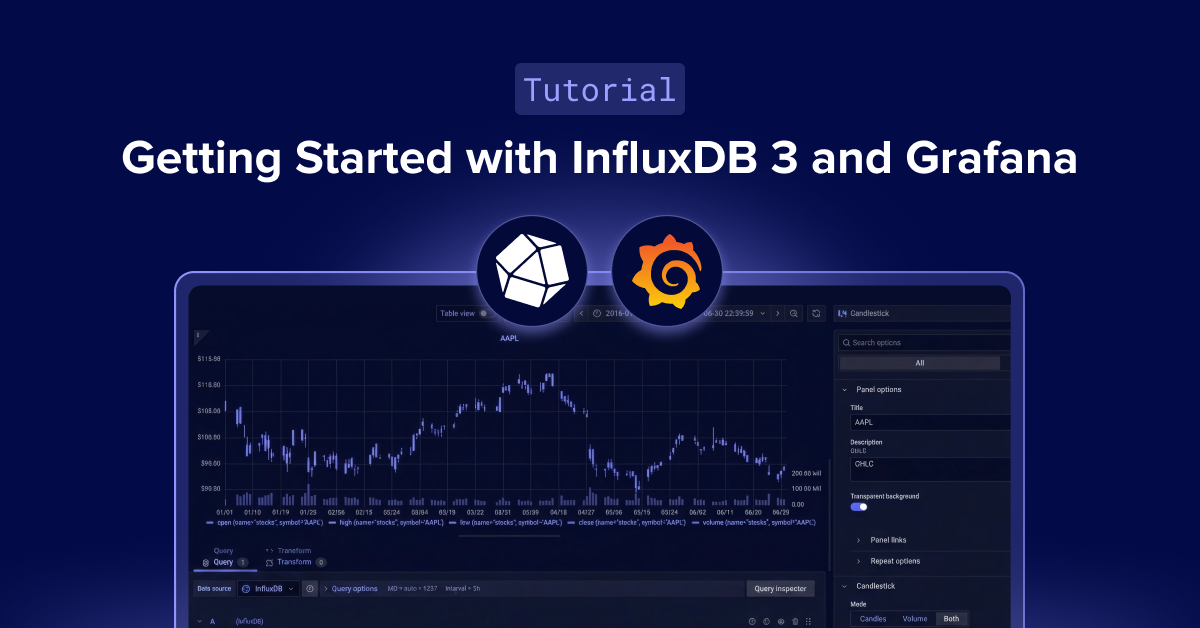

InfluxDB and Grafana are the most common pairing in time series monitoring, and division of labor between them is simple. InfluxDB stores and queries the data: high-volume, time-stamped readings from sensors, servers, meters, vehicles, and anything else that emits time series. Grafana visualizes the data: dashboards, time series panels, stat tiles, state timelines, and alerts.

 
Community

Got a project using InfluxDB? Share it with us:

  Post in our Discord or Slack Community and tag us

  Share on Linkedin with #InfluxDB or #InfluxData


  Submit your story and get a free InfluxData hoodie