We have published a new article in our blog.
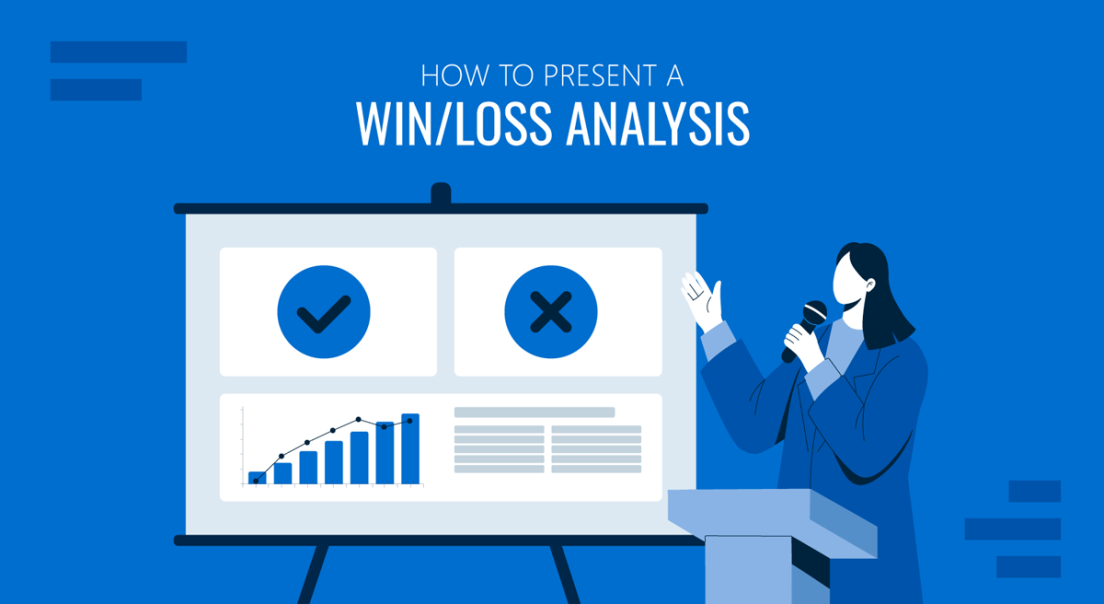
A practical guide to structuring, designing, and presenting a win/loss analysis so sales, product, and leadership act on it.
Previous articles from our blog:
Pie charts make proportional data easy to grasp at a glance. This guide walks you through how to create one in PowerPoint and customize it.
See the exact Copilot prompt that reads an Excel address list and drops pins, city labels and a filled table onto a map slide.
Check out some of our latest templates, 100% Editable and ready to use in your presentations.
Do you have any questions?Contact our 24/7 Support Center: support@slidemodel.comFeel free to email us at any time.